Geometry
Geometry is the branch of mathematics concerned with questions of shape, size, relative position of figures, and the properties of space.[f]
Radian
The ratio of the circumference of a circle to the diameter is a constant called pi, written using the Greek letter π. Pi has no units because it is a ratio of two measurements with the same units.
C / d = π
The diameter of a circle is double the radius, so we can rewrite the above ratio as:
C / 2r = π
This means that the ratio of the circumference to the radius is (multiply both sides by 2):
C / r = 2π
Since division tells us how many of the denominator fit into the numerator, this means that a circle has radii in the circumference. If we take the inverse, then we find that one of these radii as compared to the entire circle, is equal to:
1 radian = 1 / 2π
Since 1 radian is a ratio of length to length, there are no units. A radian is a unit of angular measure and can be treated as a percentage of the arc of an entire circle. Therefore, 1 radian measures an angle, just like degrees. There are 360 degrees in a circle and there are 2π radians in a circle.
Figure 1 shows a radius of a circle and an arc of that same length. This angle, which is a fractional part of a whole circle and there has no units, is known as 1 radian.
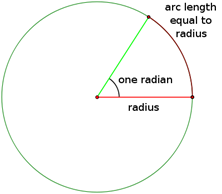
Figure 1 – Diagram of Radian[f]
Steradian
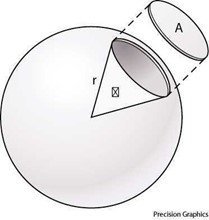
A steradian is the same idea as a radian, but in three dimensions instead of two. A steradian (abbreviated as “sr”) is another name for square radians, abbreviated as “rad2”. This is called a solid angle and is an area in two dimensions.
The circumference of a circle is: C = 2πr. Also, the circumference of a circle is 2π radians. Since these are the same thing, we can set them equal: 2πr = 2π radian. Divide both sides by 2π to get: r = 1 radian. Therefore, whenever we see ‘r’ for radius, we can replace the ‘r’ with ‘1 radian’.
The surface area of a sphere is: SAsphere = 4πr2. If we use 1 radian for the radius, we get:
SAsphere = 4π (1 rad)2 = 4π rad2 = 4π steradian = 4π sr
Since there are 4π steradians in the surface area of a sphere, then 1 steradian is the inverse.
1 steradian = 1 / 4π
A steradian is a unit of solid angular measure. Figure 2 shows 1 steradian. Be careful, the section A is curved, not flat.
International System of Units (SI)
There are 7 SI base quantities (time, length, mass, electric current, thermodynamic temperature, amount of substance, and luminous intensity). The base units use an arbitrary, but useful, quantized value. For example, the definition of 1 second is the quantum value 9,192,631,770 cycles of the cesium 133 atom.
Time – 1 second = 9,192,631,770 cycles of the cesium 133 atom. Inverse = 1 Hertz.
Length – 1 meter = 1/299,792,458th of the length travelled by light in a vacuum in 1 second. Inverse = Speed of light.
Radiometry
Radiometry is a set of techniques for measuring electromagnetic radiation, including visible light.[f]
Joule
The joule is equal to the energy transferred to an object when a force of one newton acts on that object in the direction of the force’s motion through a distance of one meter.[f]
Watt
A watt is 1 joule per second.[f]
Radiant Flux
Radiant flux (or radiant power) is the radiant energy emitted, reflected, transmitted or received, per unit time, measured in watts.[f]
For example, the radiant flux of an incandescent light bulb might be 60 watts. The radiant flux for the human visible part of the spectrum is just 6 watts while the other 54 watts are emitted as heat radiation.
Radiant Intensity
Radiant intensity is the radiant flux emitted, reflected, transmitted or received, per unit solid angle and is measured in watts per steradian.[f]
For example, if a 60-watt incandescent light bulb radiates in all directions of space and has a radiant flux of 60 watts, then we must divide the 60 watts by the total surface area to get the amount of energy within 1 steradian.
60 watts / 4π steradian = 4.78 watts / steradian
The 4.78 watts/steradian measures the intensity of the radiation, not just the total amount.
Photometry
Photometry is the science of measuring the human visible portion of the electromagnetic spectrum.[f]
Figure 3 is a diagram of the electromagnetic spectrum. The higher energy, shorter wavelengths are towards the left and the lower energy, longer wavelengths are towards the right. Photometry measures the slice of the electromagnetic spectrum that is between 400 nanometers and 700 nanometers that is visible to the human eye.
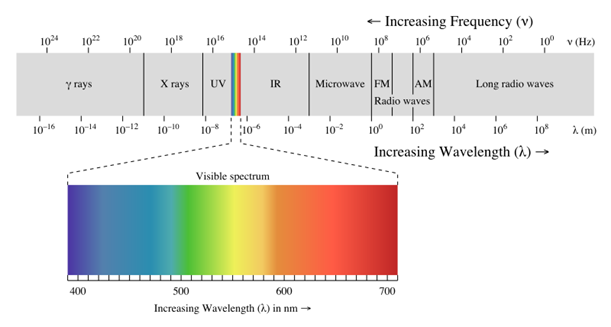
Figure 3 – Visible Light on the Electromagnetic Spectrum[f]
Since photometry deals with the human visible part of the spectrum and how a human perceives the light, we must know about the sensitivity of the receptors of the human eye.
For daytime, humans use mostly the cone cells of the eye to see. This is called photopic vision and is most sensitive at 555 nanometers. For nighttime vision, humans use mostly rod cells. This is called scotopic vision and is most sensitive at 507 nanometers. Mesopic vision is the transition between photopic and scotopic vision. Figure 4 shows rods and cones under a scanning electron microscope.

Figure 4 – Rod and Cone cells.[f]
The photopic scheme is used when the light is greater than 3 candela per square meter (> 3 candela/m2). The scotopic scheme is used when the light is less than 0.003 candela per square meter (< 0.003 candela/m2).[f]
Figure 5 illustrates some of the vocabulary we need for understanding photometry.
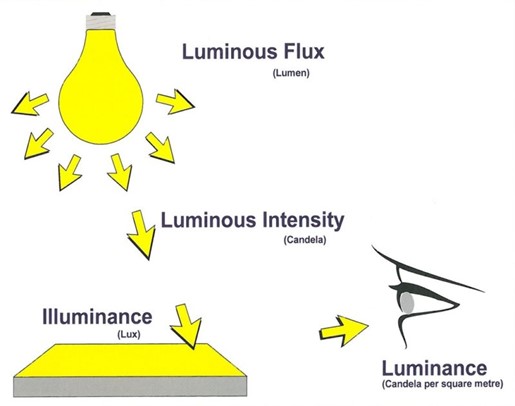
Figure 5 – Photometry Vocabulary[f]
Lumen (Unit of Luminous Flux)
A lumen is defined as the amount of visible light emitted per unit of time. Lumen is analogous to watt but narrowed to just the portion of energy that represents visible light. The lumen is specifically tied to human vision. So, lumen is an amount of visible light energy per unit of time.
A lumen is equal to 1/683 of a watt at 100% 555 nanometer green. Taking the inverse means that there are 683 lumens in 1 watt at the 100% 555nm wavelength. For comparison, there are 0 lumens in 1 watt at 100% 700nm infrared wavelength because there is no visible light at that wavelength. Using the photopic spectral luminous efficiency function of weighting for the visible spectrum leads to most of the weight being given to 555nm and only 0.4% to infrared. [f]
Luminous Flux
Luminous flux (or luminous power) is the same as radiant flux, except that luminous flux is adjusted to reflect the varying sensitivity of the human eye to different wavelengths of light and is measured in lumens.[f]
A 60 watt incandescent light bulb produces about 870 lumens of luminous flux. Luminous flux radiates in all directions of a sphere, as shown in Figure 6.
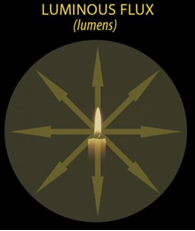
Figure 6 – Luminous Flux is measured in all directions in lumens[f]
Candela (Unit of Luminous Intensity)
The candela is analogous to radiant intensity, but candela is used for luminous intensity (see below) and is weighted by the luminosity function for visible light and is dependent on the perception of the human eye.[f] Candela is equivalent to watts per steradian.
1 candela is how bright the eye perceives 1 candle per steradian. Because candela is measured per solid angle, 1 candela near the candle is still 1 candela 10 meters away. Candela measures the amount of visible light energy at the source.
The candela measurement unit uses a weighted luminosity function for visible light. The weighting function uses 555nm (yellow-green) for peak sensitivity of photopic vision, and 507nm (blue-green) for peak sensitivity of scotopic vision. Candela refers to photopic vision. Scotopic Candela refers to scotopic vision.
A 25-watt incandescent light bulb is about 135 candela, or 135 candles per steradian.[f]
Luminous Intensity
Luminous intensity is analogous to radiant intensity but is based on the luminosity function which uses only the visible spectrum of radiation and is measured in candela. Figure 7 shows that luminous intensity is measured per solid angle.
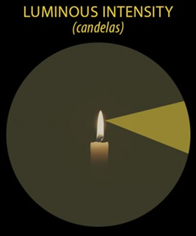
Figure 7 – Luminous Intensity is measured in one solid angle in candelas.[f]
Lux (Unit of Illuminance)
Lux is a measure of the luminous flux per unit area (square meters).[f]
Whereas luminous flux measures how much human visible light energy is emitted in total from a source, lux will measure how much of that energy falls onto a flat surface and will depend on how far the detector is from the source.
Illuminance
Illuminance is the amount of light hitting an area of surface and is measured in lux. Illuminance does not depend on the type of surface the light is landing on. Figure 8 shows light energy landing on a two-dimensional flat surface.
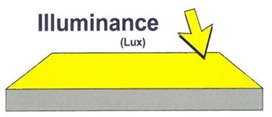
Figure 8 – Illuminance is measured in lux.[f]
Candela per Square Meter or Nit (Unit of Luminance)
Nit is the name sometimes used for candela per square meter.
Candela per square meter allows us to measure how much light energy is falling onto the human eye through a solid angle and is therefore a measure of brightness.
Luminance
Luminance is a measure of the human-perceived brightness of an object through a given solid angle and is measured in candela per square meter or nits. Luminance is dependent on the type of surface that the light is reflected off.
Since luminance is measured through a given solid angle (specifically, the angle subtended by the human eye), we can describe the amount of energy being emitted at the source and landing on the eye. The distance between the observer and the source of light will not change the luminance value.
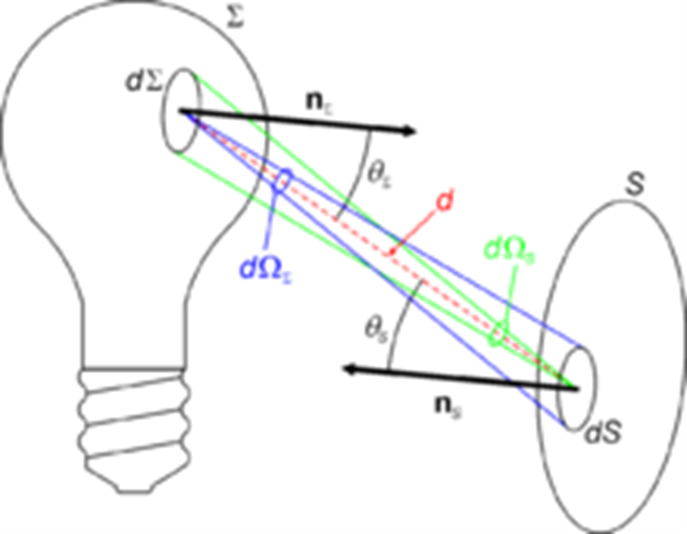
Figure 9 – Luminance value is unchanged over distance.[f]
Luminance refers to photopic vision (daylight). Scotopic luminance refers to scotopic vision (darkness).
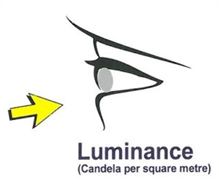
Figure 10 – Luminance is measured in candela per square meter or nit[f]
Comparison of Light Measurements
Each of these four lighting measurements are per unit of time.
| Type of Measurement | Units | How Measured | Comments |
| Luminous Flux | Lumen | Spherical Total | Lumens is unchanged by distance or angle |
| Luminous Intensity | Candela | Per Solid Angle | Candela is unchanged by distance |
| Illuminance | Lux | Per Flat Area | Lux changes by distance |
| Luminance | Candela/m2 (nit) | Per Solid Angle | Luminance is unchanged by distance |
Luminous Efficacy
Luminous efficacy is found by dividing the luminous flux by the radiant flux.[f] This information can be used to indicate the percentage of emitted radiation that is in the visible part of the spectrum.
A 60-watt incandescent that emits 8700 watts/steradian of energy, but only 870 lumens of visible light energy, has a luminous efficacy of 10%.
Spectral Power Distribution
Spectral power distribution (SPD) describes the power per unit area per unit wavelength of an illumination.[f] Figure 10 shows the SPD of six different sources of light. The intensity of each visible wavelength is measured relative to the other wavelengths of human visible light.
The Incandescent shows a smooth increase from very little blue to lots of red. The Cool White LED shows a large spike of blue wavelength and very little red.
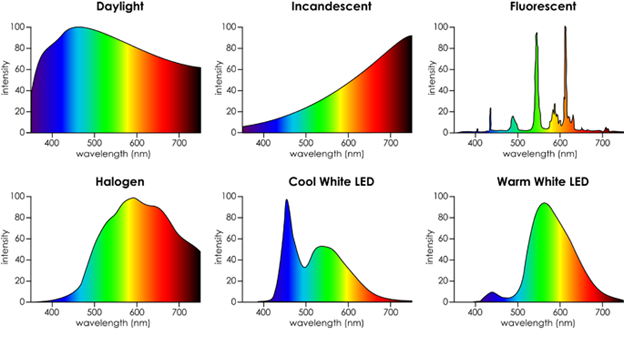
Figure 11 – Spectral Power Distribution of Different Sources[f]
Color Temperature
The color temperature of a light source is the temperature of an ideal black-body radiator of a color comparable to that of the light source.[f]
Figure 11 shows the color of the sun as it goes through the phases of sunrise to noon to sunset. At sunrise, the color is an orange/red, but by noon, the high energy blue wavelengths are most abundant.

Figure 12 – Color Temperature[f]
The color of the sun can be measured using Color Temperature, which is a mapping of colors to a reference called a black body radiator. The black body radiator is only theoretical and does not exist, but heating a piece of iron would be very similar. We use the Kelvin temperature scale for this measurement.
Figure 12 shows an iron bar that is heated to high temperatures. The iron bar emits different wavelengths of light depending on the temperature, measured in Kelvins. We can then map these colors to the temperature of the iron.
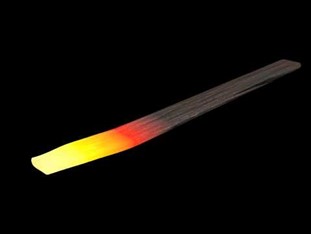
Figure 13 shows a mapping of color temperature to typical lighting sources.
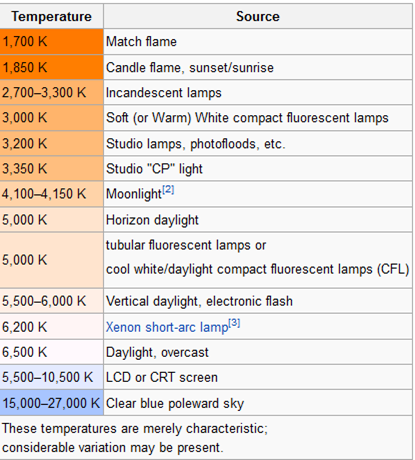
Figure 14 – Color Temperature Chart[f]
Correlated Color Temperature is used when the light source does not emulate a black body radiator. Fluorescent and LED lights do not have smooth curves, so we use CCT to approximate the dominate wavelength. CCT works well because it is a single value (in Kelvin) but CCT hides the true spectral distribution of the wavelengths.[f]
Spectral G-Index
Spectral G-Index is a variable that was developed to quantify the amount of short wavelength light in a visible light source relative to its visible emission (it is a measure of the amount of blue light per lumen).[f]
The Spectral G-Index value is essentially the sum of the energies of the blue wavelengths of light from 380nm to 500nm divided by the energies of the total human visible wavelengths of light. This G-Index concept was developed because of the larger impacts of blue wavelength light on astronomy, light pollution, human eyes, and circadian rhythms.
Figure 14 shows a graph of the Spectral G-Index as compared to an incandescent light and to LED lights with differing spectral distributions. The more blue content in the light, the smaller the G-Index. A G-Index of 1.56 (+/- .15) is the boundary between uncomfortable and/or harmful blue light and softer, more pleasing orange and amber light.
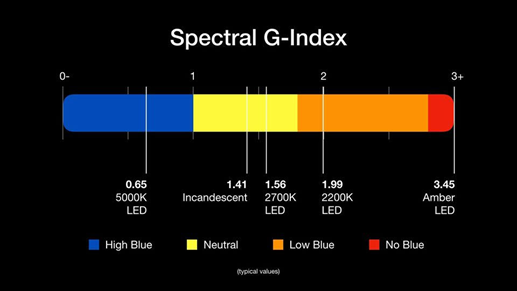
Figure 15 – Spectral G-Index[f]
Beam Angle (Apex Angle)
One measures the angle between the axis where the light gives its highest luminous intensity and the axis where that intensity is reduced to 50%. Figure 15 shows and angle θ from the center beam to the angle where the intensity of beam drops by 50%. The Apex Angle is twice angle θ, or 2θ.
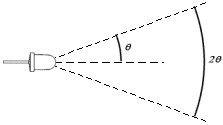
Figure 16 – Beam Angle of LED[f]
Figure 16 is another example of apex angle.
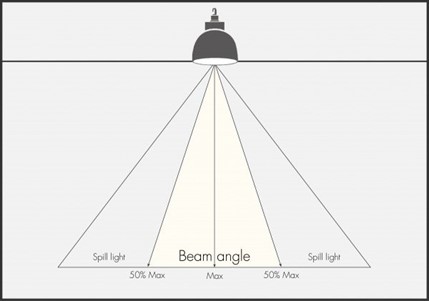
Figure 17 – Beam Angle from Light Above[f]
Maximum Beam Candlepower (Center-beam intensity)
The luminous intensity along the geometric centerline of a directional light source. The assumption in application is usually that the centerline candlepower is also the maximum candlepower.[f]
Figure 17 shows a plot of relative intensity for an LED light. The tool used to measure the intensity at each angle is called a goniophotometer. This tool is initially aimed down the center line of the light source, then rotated through a circle around the entire emitter. 0 degrees is the center of the beam and is where the light will be the most intense (most photons). As the goniophotometer is moved in a circle, there will be less and less photons at each degree away from the center beam. The relative intensity (on a scale of 0.0 to 1.0) is plotted against the degrees.
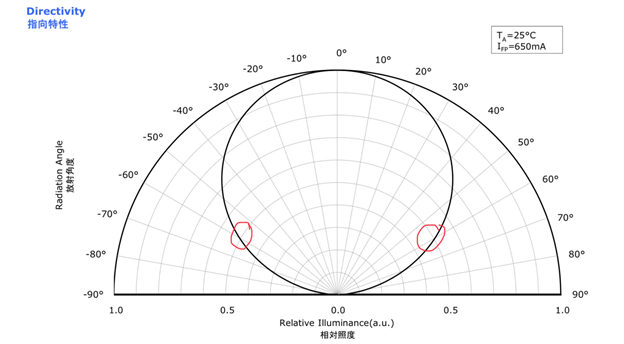
Figure 18 – Beam Angle Plot[f]
The Beam Angle (or Apex Angle) is defined as the angle at which there is a 50% reduction in light intensity. This is circled in red on Figure 17 at the 0.5 relative illuminance location. For this LED that was measured, the apex angle is 2 x 60 degrees equals 120 degrees.
Light Emitting Diodes
Electricity and Diodes
Electricity is the movement of charged particles. This movement also creates a magnetic field. A diode is a semiconductor device that essentially acts as a one-way switch for current. It allows current to flow easily in one direction, but severely restricts current from flowing in the opposite direction.[f] A Light Emitting Diode is constructed such that when the positive holes and the negative electrons combine, the energy released from the combining process is in the form of light energy as shown in Figure 9.[f]
When the positive hold and the negative electron combine, the electron loses some of its energy as it becomes bonded with the positive hole. The resulting energy is emitted in the form of photons. A Light Emitting Diode releases almost all energy in the form of light, rather than heat like the tungsten filament in an incandescent light bulb. The wavelength of the light produced depends on the energy band gap of the semiconductors used.[f]
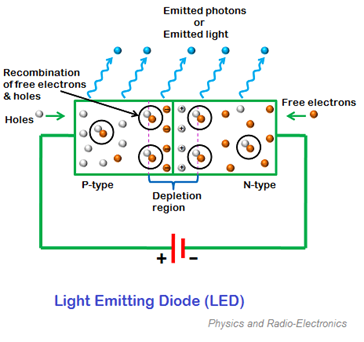
Figure 8 – LED P-N Junction Diode[f]
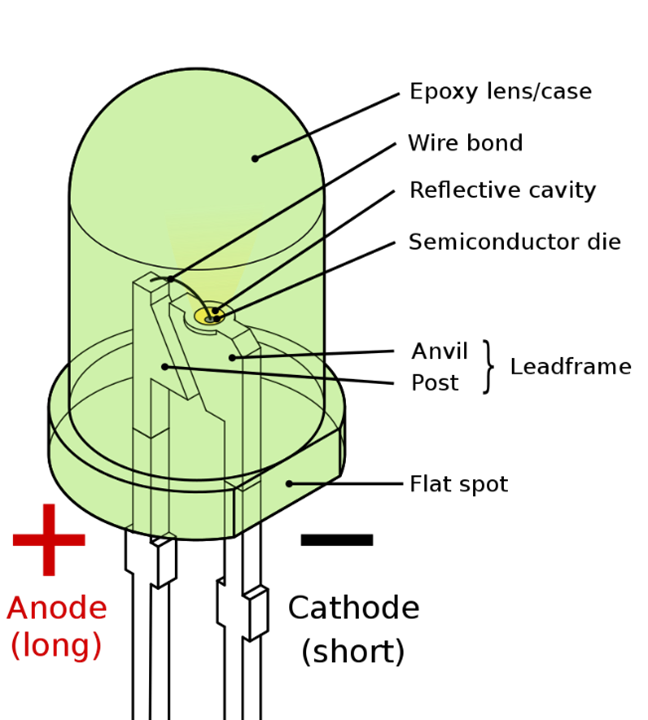
Figure 9 – Light Emitting Diode[f]
The Spectral Distribution Graph of a 5200 Kelvin Light Emitting Diode is shown in Figure 10. Notice that this SPD is dramatically different than the SPD from sunlight at noon or an incandescent lightbulb. This chart shows a large amount of blue wavelength light, very little cyan and low amounts of red.
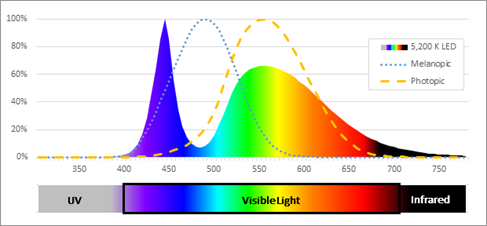
Figure 10 – SPD for 5200K LED[f]
The most common method of product white light from and LED is to use the blue wavelength LED chip and then applying a yellow phosphor coating. This is shown in Figure 11.
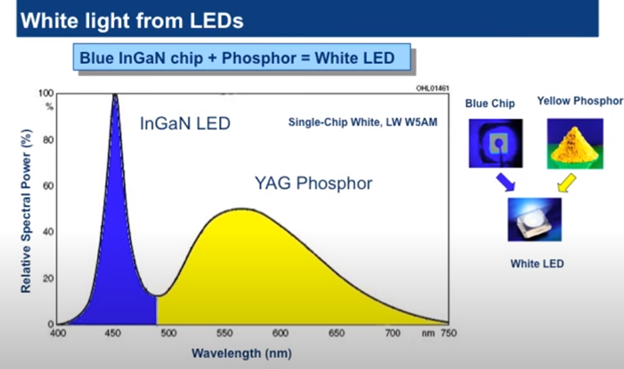
Figure 11 – White Light from LED[f]
This additive color technique produces the desired white color as interpreted by the human brain. However, the energy levels of the full spectral distribution across the visible spectrum are not smooth and contain mostly high energy blue wavelength light. This has cellular level impacts on the human eye as well as psychological impacts not associated with sunlight or incandescent light.